
This blog post describes the first of the three advantages I will develop in this blog post series – PRODUCTIVITY.
When a sales process is clearly defined, and tools are in place to measure the data, interpret it, and see the visual dashboards, it can help boost the productivity of the sales team members.
This example shows information about the sales process defined in a CRM system called Nutshell. The image below shows a screen capture of sales funnels set for one of our customers. Each stage of the sales funnel in this example uses a confidence interval carefully defined to reflect progress in the sales process for individual leads. While working closely with the sales team members, we identified a list of associated activities for each stage of the funnel.
Defining the sales path or sales stages is very critical to improving the closing rate. We help customers determine the sales funnel stages, asking the right questions.
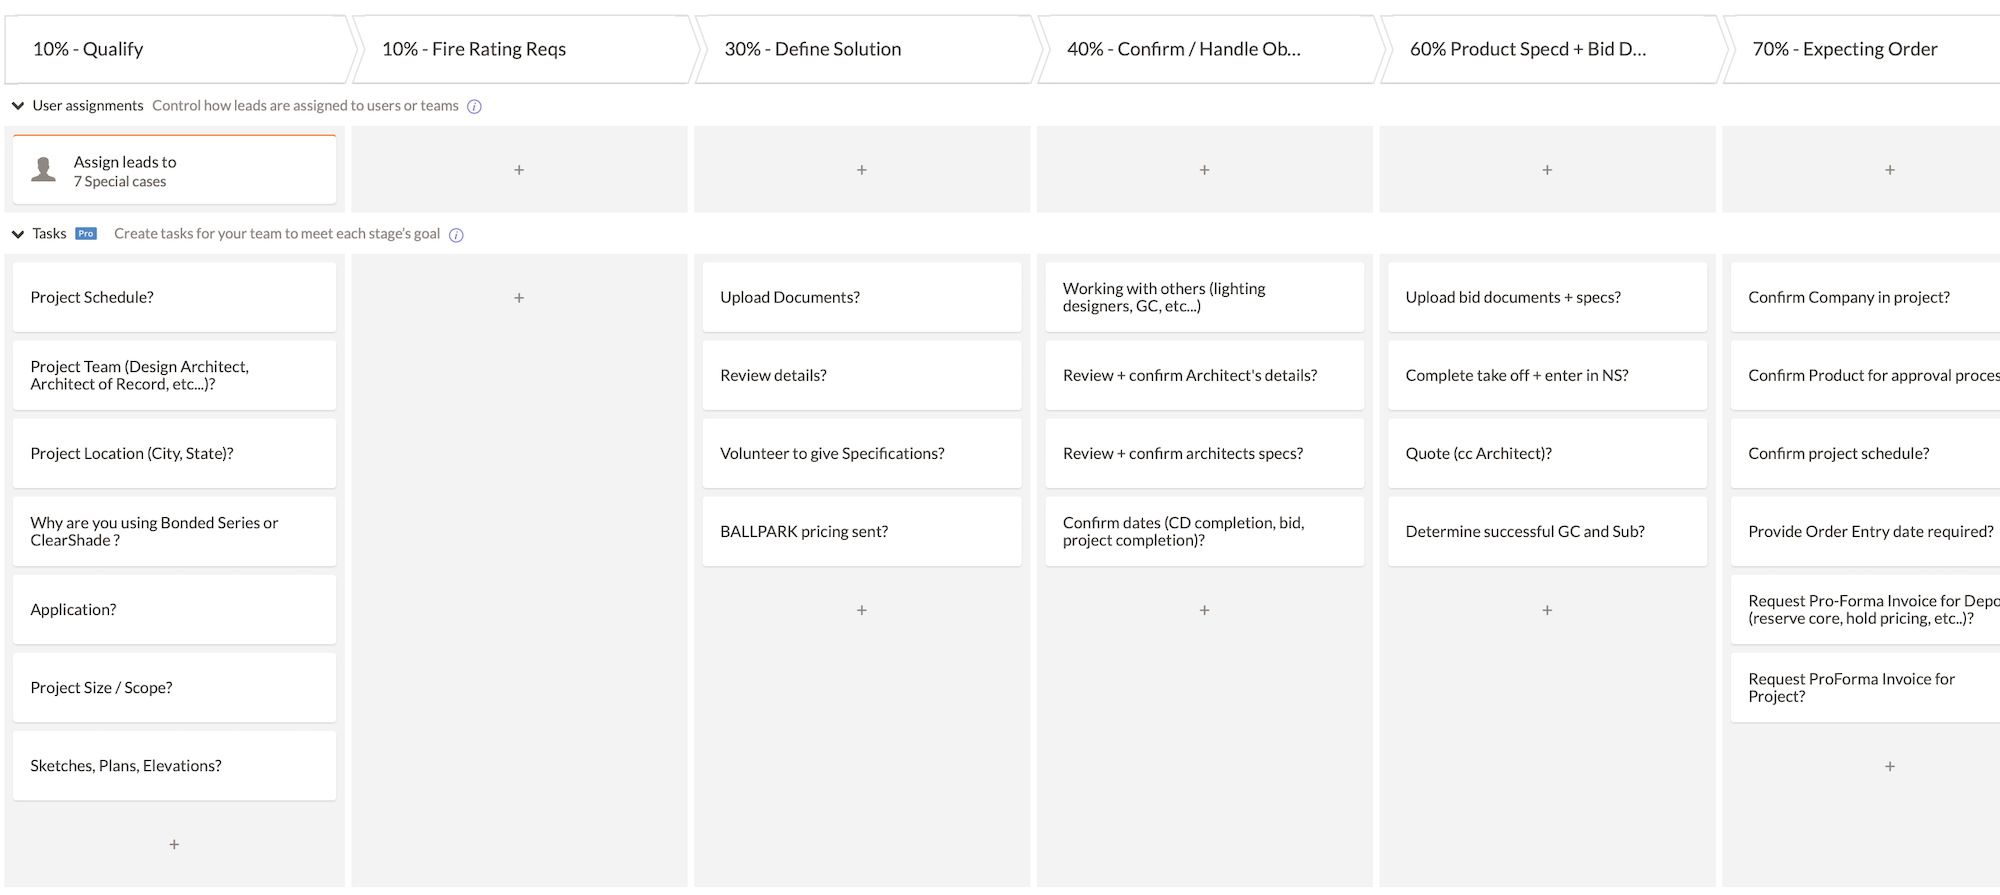
Sales Funnel Definition for Automation
We set up the CRM system so that sales team members can easily see the progress of an individual lead. The image below shows sales funnel status and update options for a prospect that the salesperson can manage.
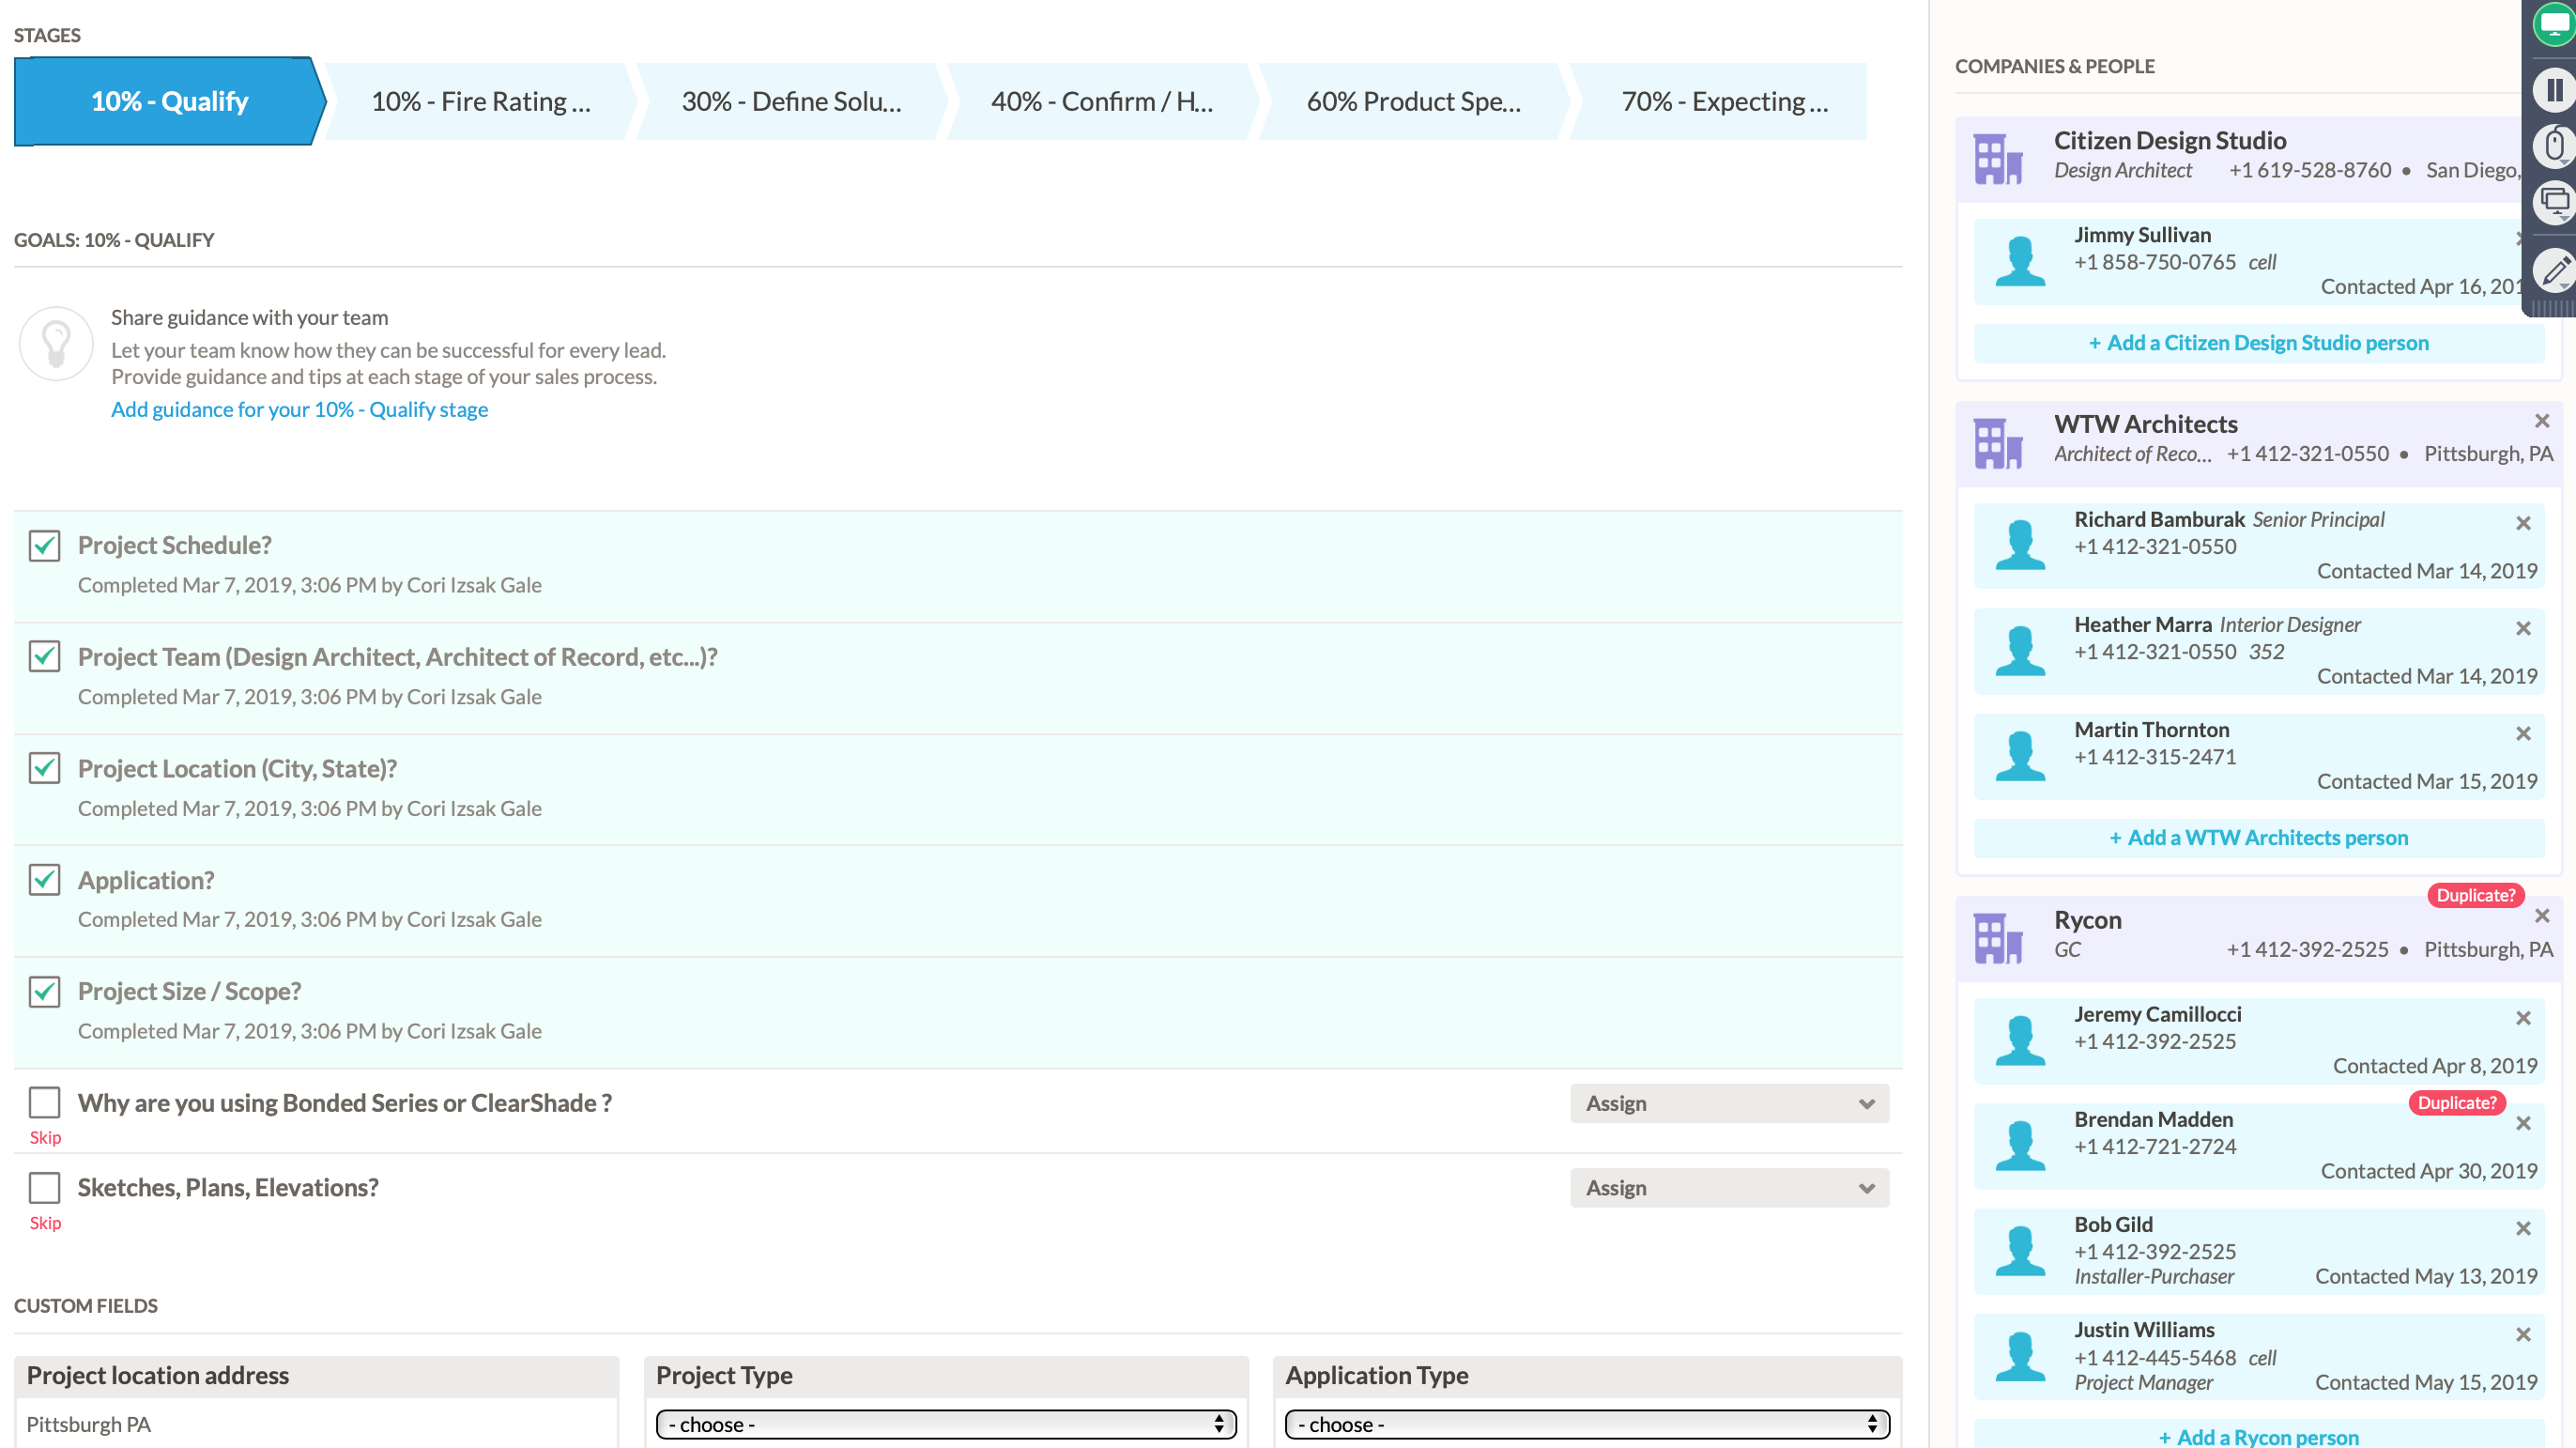
Lead Management – confidence intervals
We export the data from the CRM periodically and import it in Tableau (a business intelligence software). The pre-set custom dashboards in Tableau show the summary of all leads for each salesperson. The image below shows a Tableau dashboard with LEADS INFO DETAIL for one sales rep. This view clearly shows the areas where information is still needed to move forward the projects through the funnel. It is clear that most of the projects in the 0 to 29% confidence still need quite a bit of information, but we can also see some nulls in the 40% confidence leads. All 40% of confidence leads are projects that have been quoted and ideally should not have any nulls in the data.
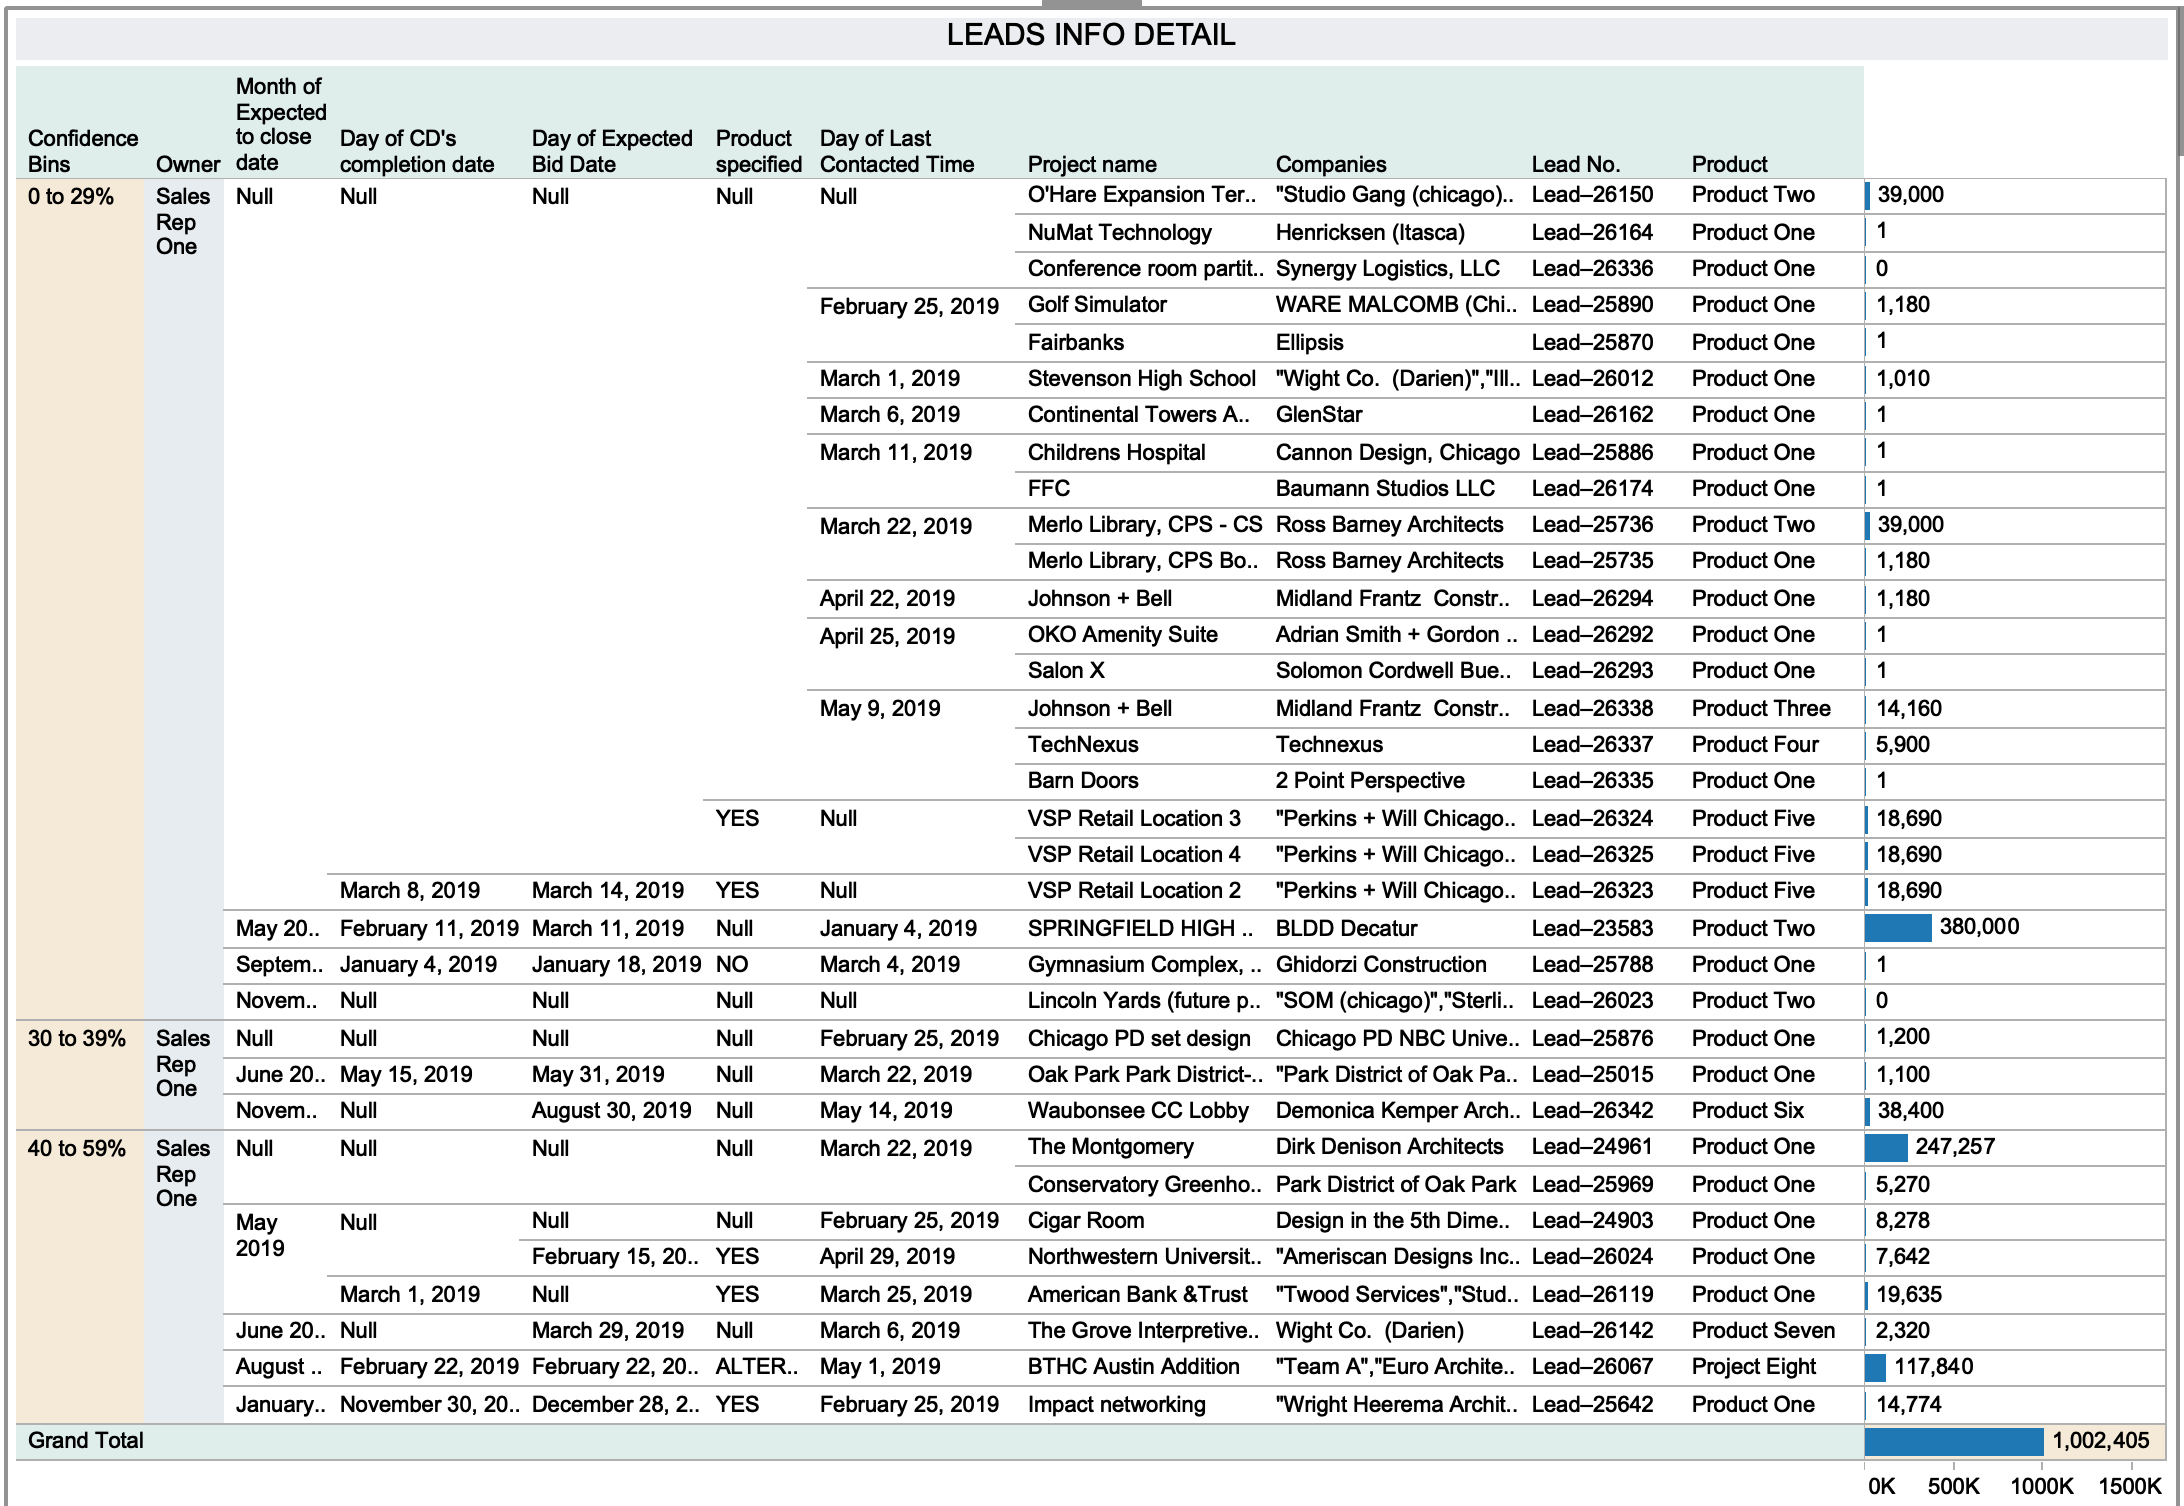
Leads summarized by the confidence interval.
With similar dashboards for each salesperson, the leadership team gets to see and understand the progress and activity level for each salesperson over time.
Sales team members also have a compact summary with a list of leads for each confidence interval. These summary tables make it easier for them to identify the next step for each opportunity, boosting their productivity and also saving time.
We created email templates in the CRM system for each stage (or confidence interval) of the sales funnel. With this, the sales reps can send a customized, pre-defined message in a matter of clicks directly from the system. The streamlined process to send emails makes sales strategy execution even more efficient for the sales team.
Stay tuned on my other two blog posts in this series on the Intelligent Sales Strategy – INSIGHTS, and STRATEGY.


Questions or Comments?